The software and decision intelligence metrics that held true for the last 20 years is not true anymore. AI models are bringing the PHD and MBA level intelligence out of the box to every individual in an organization.
The models get more intelligent and easily deployable every day. We are seeing routine tasks getting automated and complex problems diagnosed and solved with minimal human oversight.
How do we measure success and failure of a decision system today?
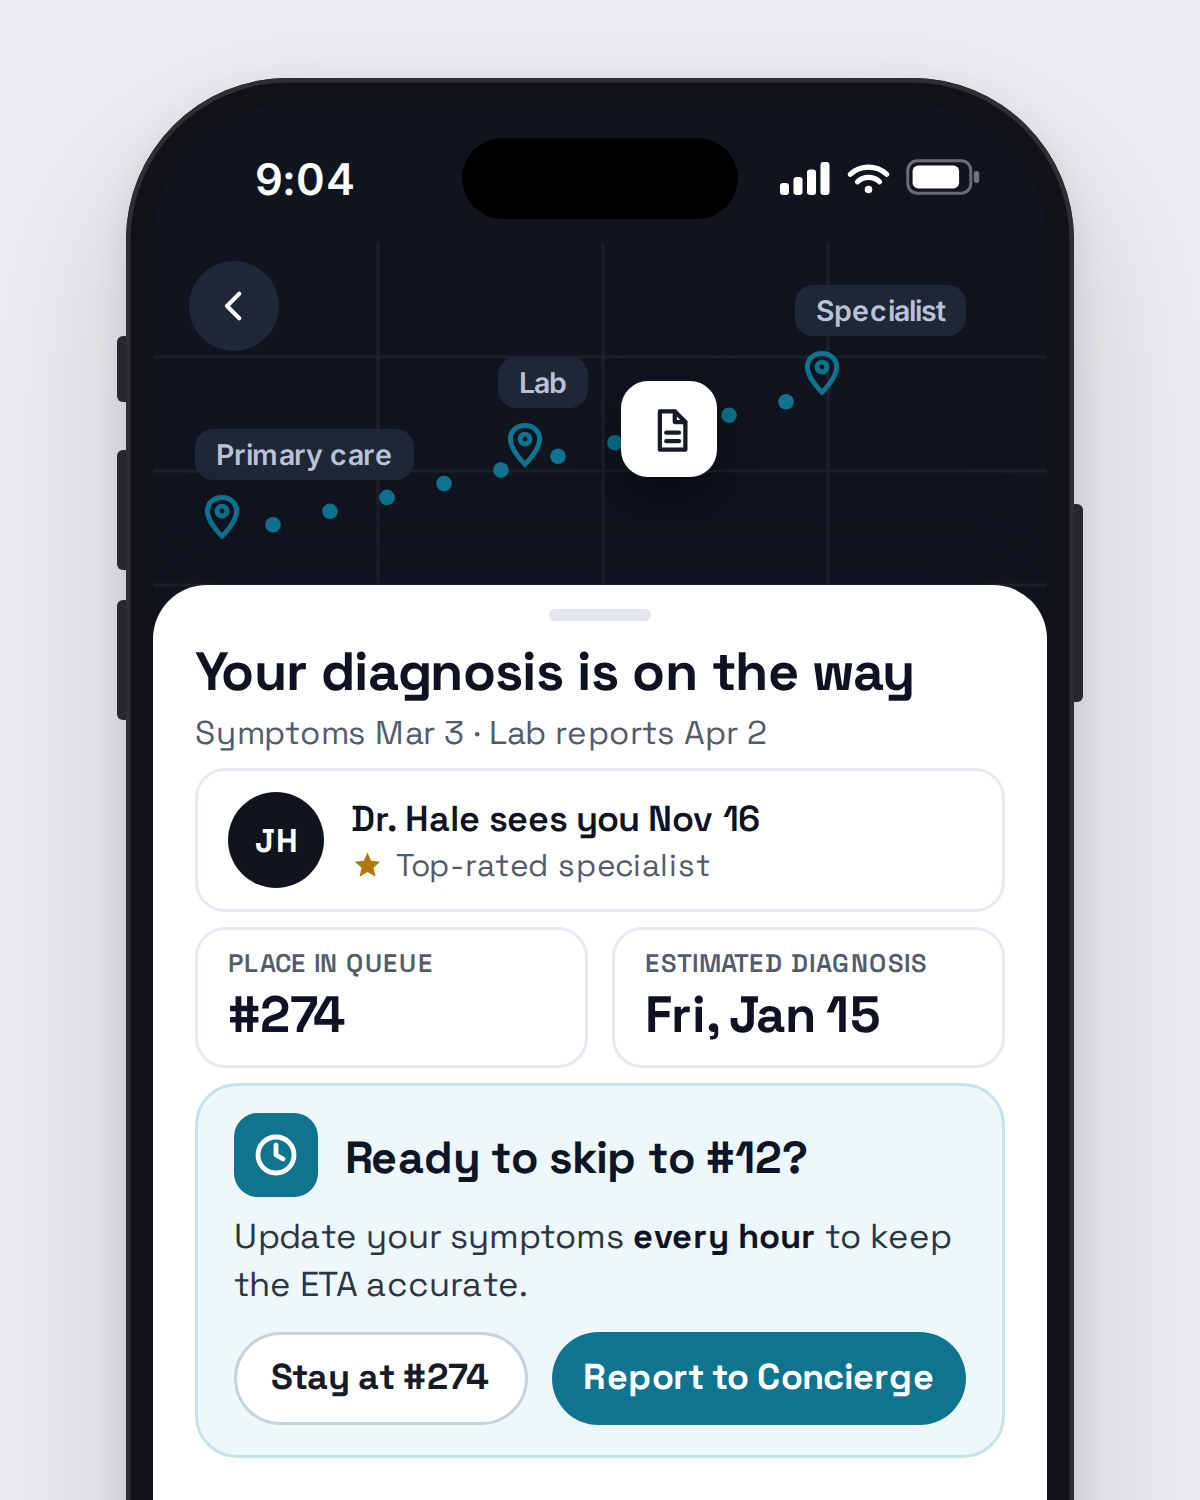
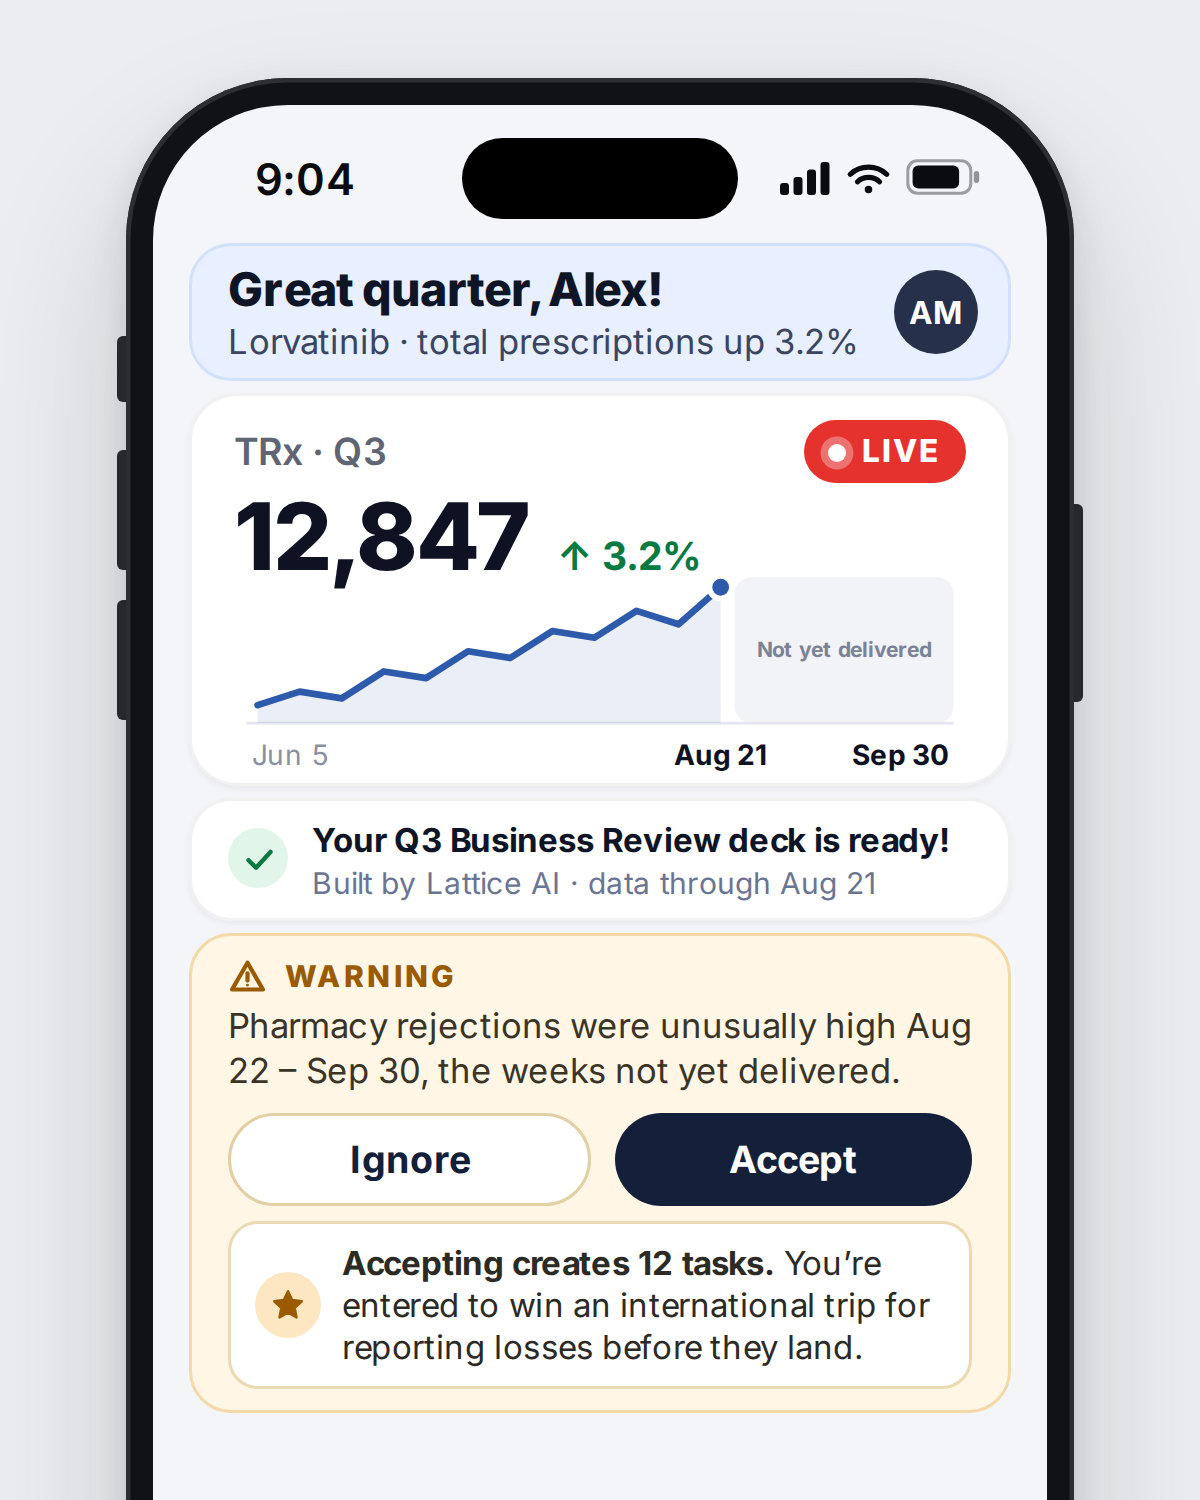
I started drawing screens. Each one is a fictional product from somewhere in Pharma or healthcare - a BI dashboard, a CRM trigger, a patient support center, a diagnostics app, a forecasting model, a trial progress tracker.
After I drew 50 of them, I started to notice the same handful of failures to progress from signal to action. A signal first exists somewhere in your system - the rejection at a pharmacy counter, a lab result, an adverse event, a competitor’s first script. Some are about seeing the signal at all. Some are about measuring it honestly. Some are about trusting what the machine tells you. Finally getting to the action that compounds, making every fix along the way pay for each other.
Then, it led me to a series of questions to diagnose coordinates of an organization or a project’s “signal to action” journey.
I. Seeing
- Latency: When did we act, and when did the system first know?
- Observability: Can we see it, or do we infer it?
- Coverage: What are we not seeing, and do we know how big it is?
- Resolution: How many records is one customer, one transaction?
II. Measuring
- Proxies: If this number went to 100%, would anyone be better off?
- Guardrails: Which of our hard stops has ever prevented harm, and which have only prevented work?
- Alignment: When the system and the person disagree, whose side does the software take?
- Ground truth: Compared to what real world observation, who chose the objective and comparison?
III. Trusting
- Verification: For any claim the system makes, how many clicks to the evidence?
- Governance: For the last automated decision that touched a patient or a dollar: who owns it, who approved it, where is the OFF switch?
- Delivery: Where does the answer show up, and is that where the decision gets made?
- Evaluation: When did we last measure this against the world as it is now, what drifted and what did we retire?
IV. Compounding
- Compounding: When a decision layer is connected (one record per person), decisioned (ranks the next action inside its window) and delivered (inside the tools people already use), the value of going from signal to action compounds.
A scorecard for compounding your decision intelligence
When you know your coordinates and progress towards compounding the value of acting on your signals, each fix will make the next one cheaper. The first brand, the first specialty pays the identity spine, and the third gets it free; the fourth model build takes one week because the first three took six weeks. When we do not act, a gap that sits unanswered costs every day it is open; on the other side, a connected system propagates its mistakes at the same speed.
Ask how your organization or team recognizes and applies it in the AI/ML projects. In the next project or business review: you can share which dimension has the most points; which gaps cost us the most in the last quarter; what can be enabled to fix the gaps and who pays for the first fix.
Fictional screens carry more truth
I will share fictional products and invented screens. Every screen is a symptom on one of the twelve dimensions in the scorecard – the ways a decision system fails between the moment it knows something and the moment anyone acts.
A fictional screen leaves only the behavior and pattern; the target is not a vendor or an organization. You, the people who operate these screens every day are their best-informed critics.
First screen that I drew is a BI dashboard.
Then a diagnosis app.